
20160921 093815
The point in finding its scale is to program Yoshimi, a soft synth, to play in tune with it. The microtonal tuning of Yoshimi will be covered in another tutorial.
Step 1 : Sample individual notes of the scale to a soundfile
If you can play the instrument, record its scale, one note at a time, pausing between each note. Doing this for my flute, resulted in this lovely soundfile:
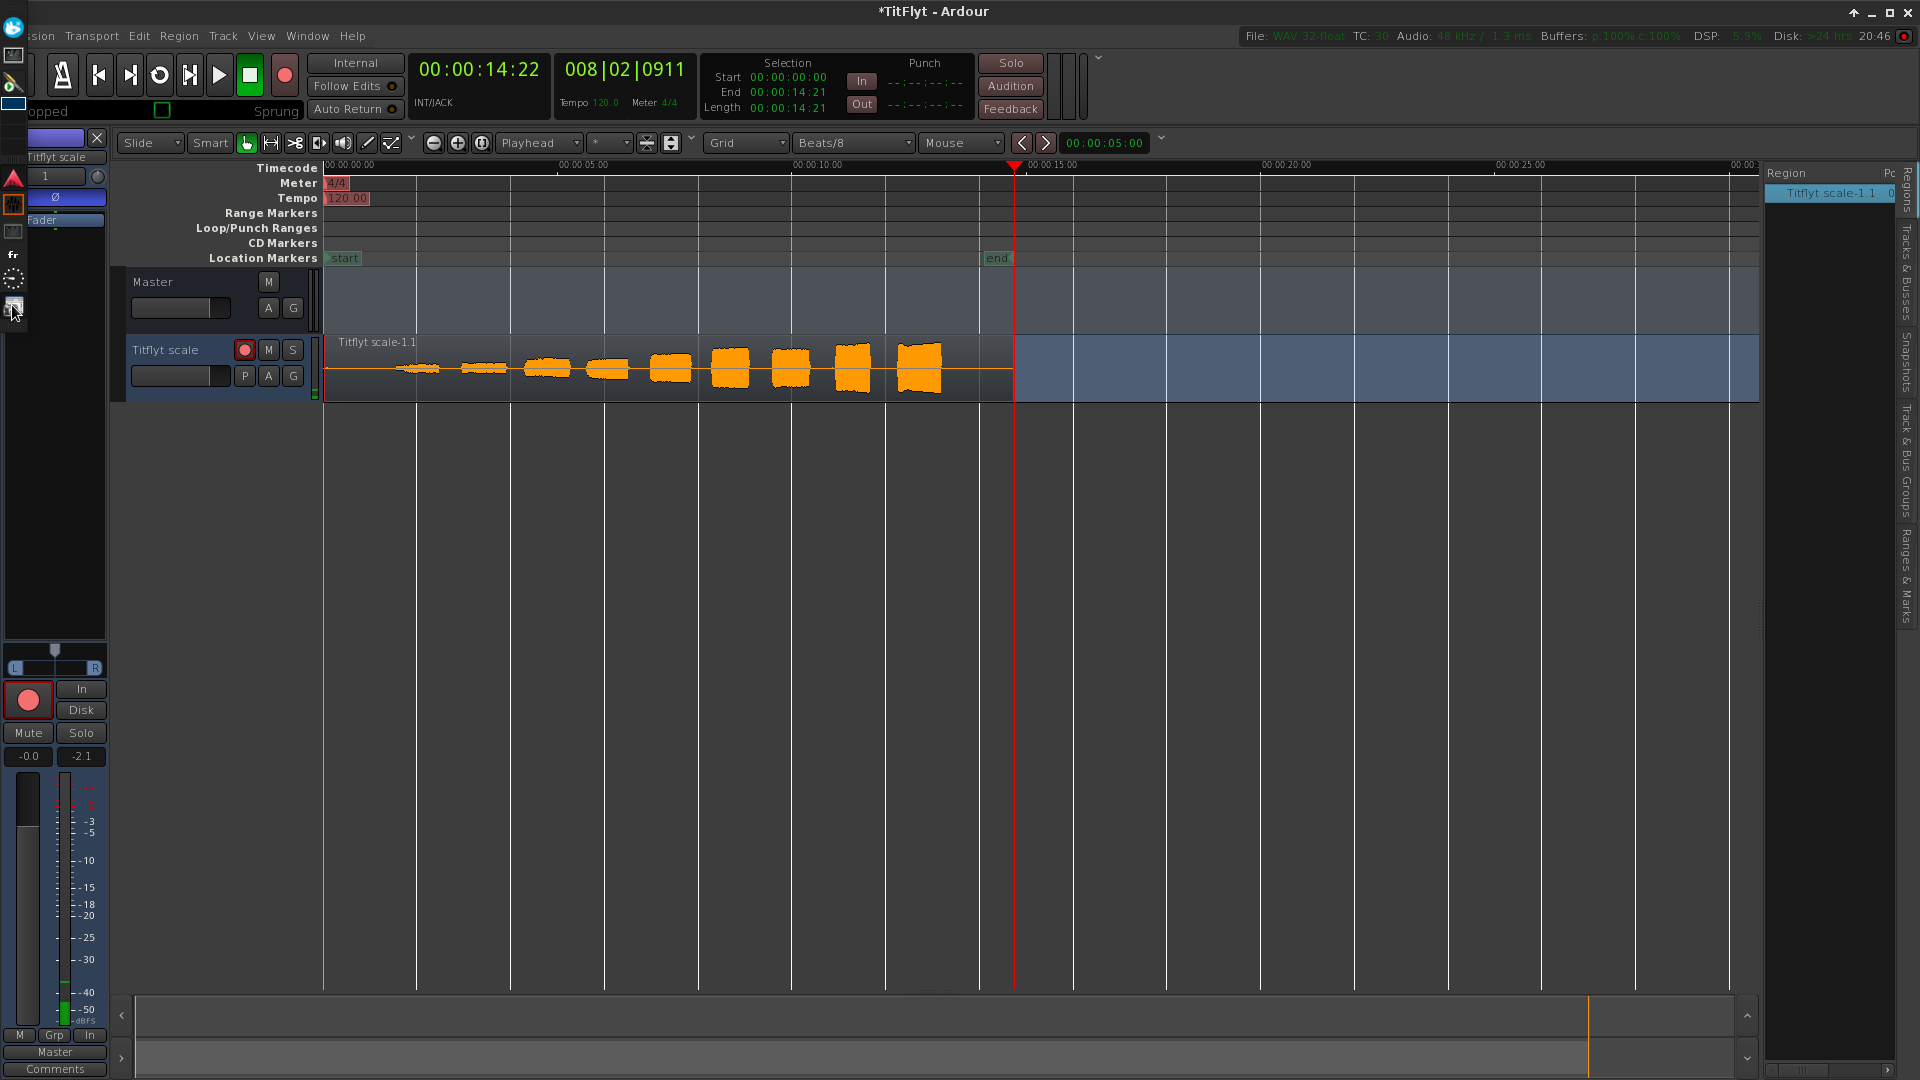
Recording the scale in Ardour
NB: Sonic Visualiser can’t record or edit files. Record in Ardour or Audacity, edit in either or in mhwavedit, which is blazing fast.
Step 2: View the file in Sonic Visualiser
Load the file in SV and ask it to "Add Spectrogram" in the Layer menu. You’ll get something like this:

Initial spectrogram in SV
A spectrogram represents the evolution of the sound spectrum in time. Time is the horizontal axis, the vertical axis are frequencies in Hz, and the energy in Db present at each frequency is represented by a colour scale (from dark green to red on the above image).
First, we want to refine the view :
- increase the window size : this will give more resolution en the frequency domain
- use logarithmic scales for Db and Hz : this will make the graph closer to human perception and easier to read
- I also changed the colourscale to blue, but this is entirely cosmetic.
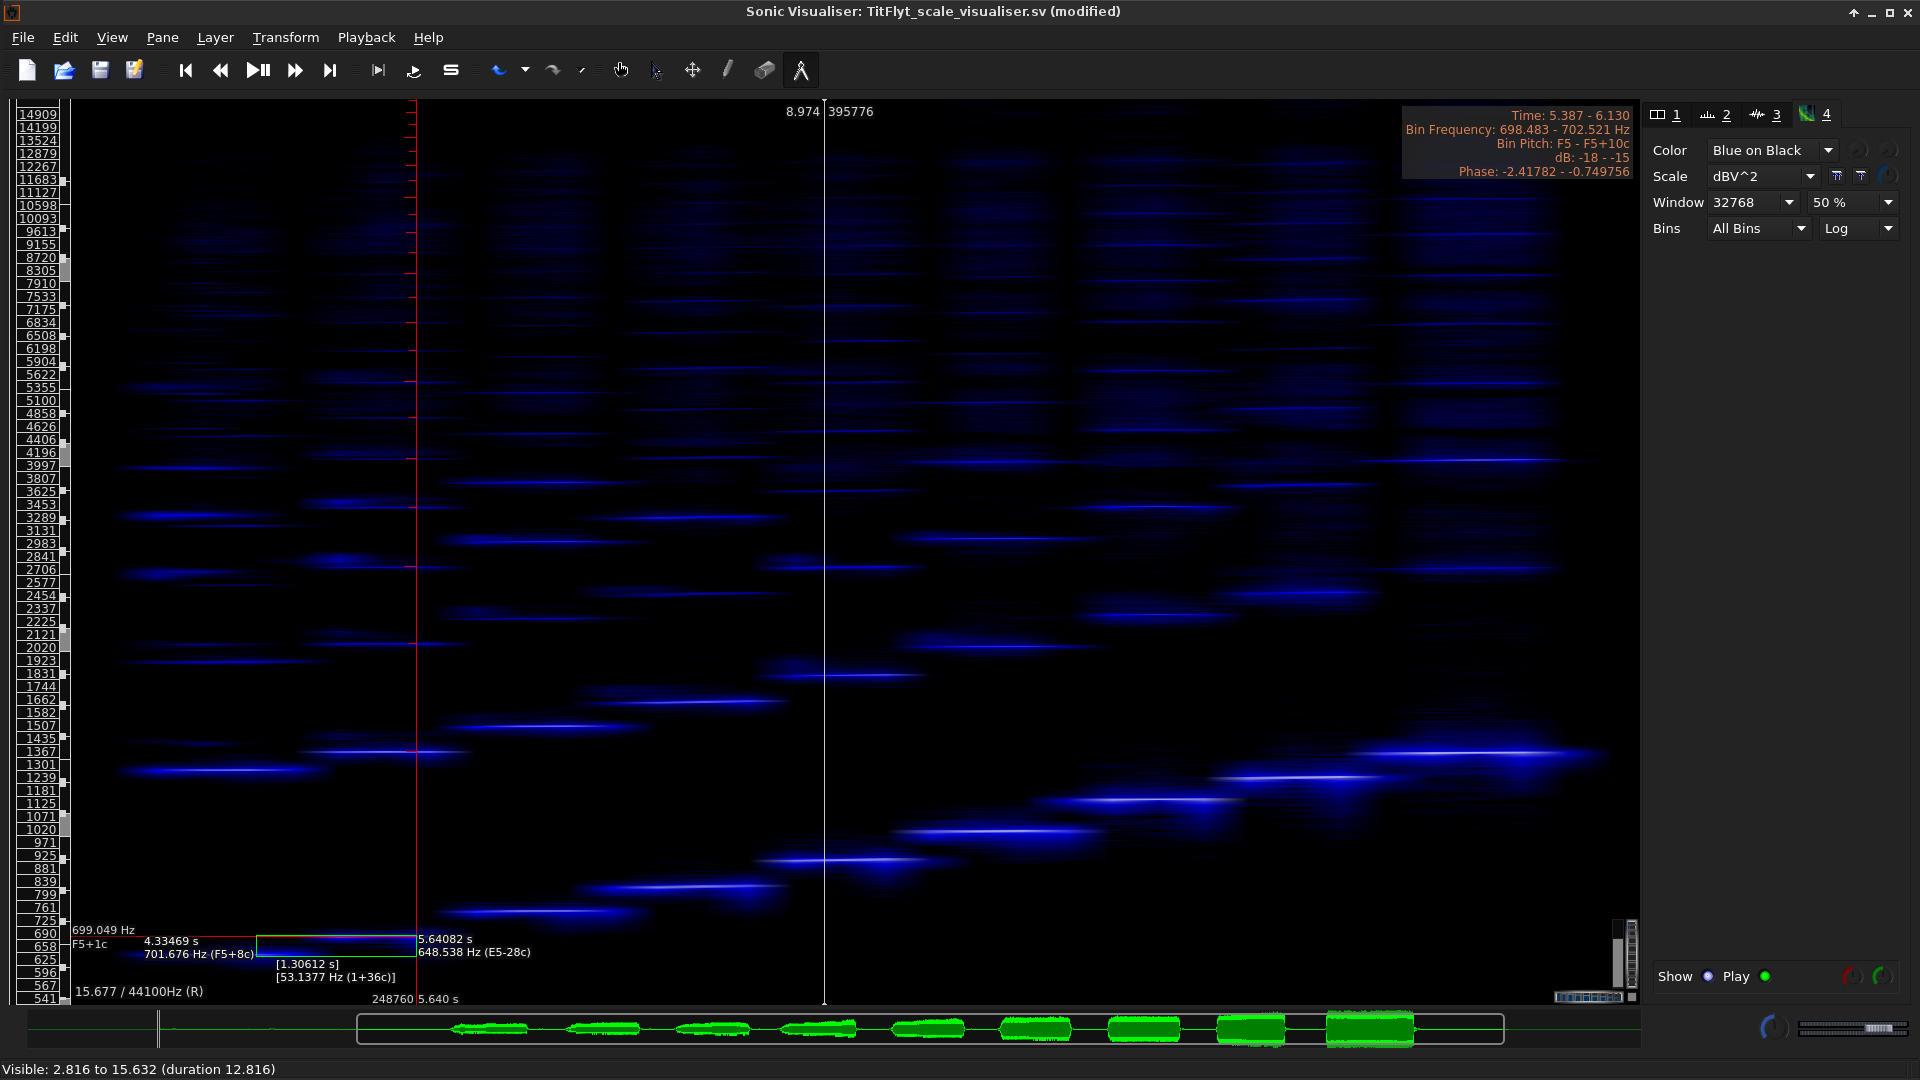
Here’s the result. Note the new settings on the right:

Improved spectrogram view
We want to measure the fundamental pitch of each note. As its name implies, the fundamental is the lower bar with energy for that note. It is not necessarily the most energetic bar though. Quite often indeed the second or third harmonics hold more energy than the fundamental. Nevertheless, the perceived pitch is the fundamental, because the brain doesn’t only listen for energetic clues. It also scans the spectrum for significant harmonic patterns.
A note on harmonics
Per definition, a harmonic is a wave with a frequency that is a positive integer of another fundamental frequency. For example 200Hz (f), 400Hz (2f), 600Hz (3f), 800Hz (4f) form a harmonic succession. The fundamental, here 200Hz, is usually counted as the first harmonic.
NOT ALL SOUNDS HAVE HARMONICS ! Musicians sometimes confuse overtones and harmonics. In a complex soundwave, overtones are just any frequencies greater than the fundamental. All harmonics are overtones, but the reverse is not true.
In fact, only periodic sounds have harmonics. In the musical world, periodic sounds imply constant supply of energy. Voices, violins, flutes for example have harmonics. Pianos, guitars, drums have not. Although the overtones of a guitar sound may be quasi-harmonic, they are never organised exactly as f, 2f, 3f etc. This difference matters when we read a sonagram and especially when we want to measure things in it.
Measuring the fundamental
Pick up the measure tool in SV’s toolbar. As you move it on the graph, updated measurements are displayed in the upper right corner. "Bin frequency" is the one we want. It is actually a range of frequencies, because the Fast Fourrier Transform (the algorithm which analyses the spectrum) works in "windows". The bigger the window size, the thinner vertically will be the box.
If our sound is harmonic, we can also take advantage of its regular organisation to evaluate the fundamental even more precisely. The measure tool in SV has small ticks at harmonic intervals. Instead of pointing it directly at the fundamental, we can also seek to align the ticks with the harmonics, which are usually thinner on the display.
Measuring a frequency in SV
Measures are also indicated in cents, showing the tone’s deviation from pure equal temperament.
Finally, you can also draw boxes with the measure tool. It will then indicate the interval between the boxe’s borders. Use this to get the intervals between the notes.

Measuring intervals between adjacent notes
If you plan to use the measurements in Yoshimi (see my other tutorial), measure all intervals from the lowest note of the scale.
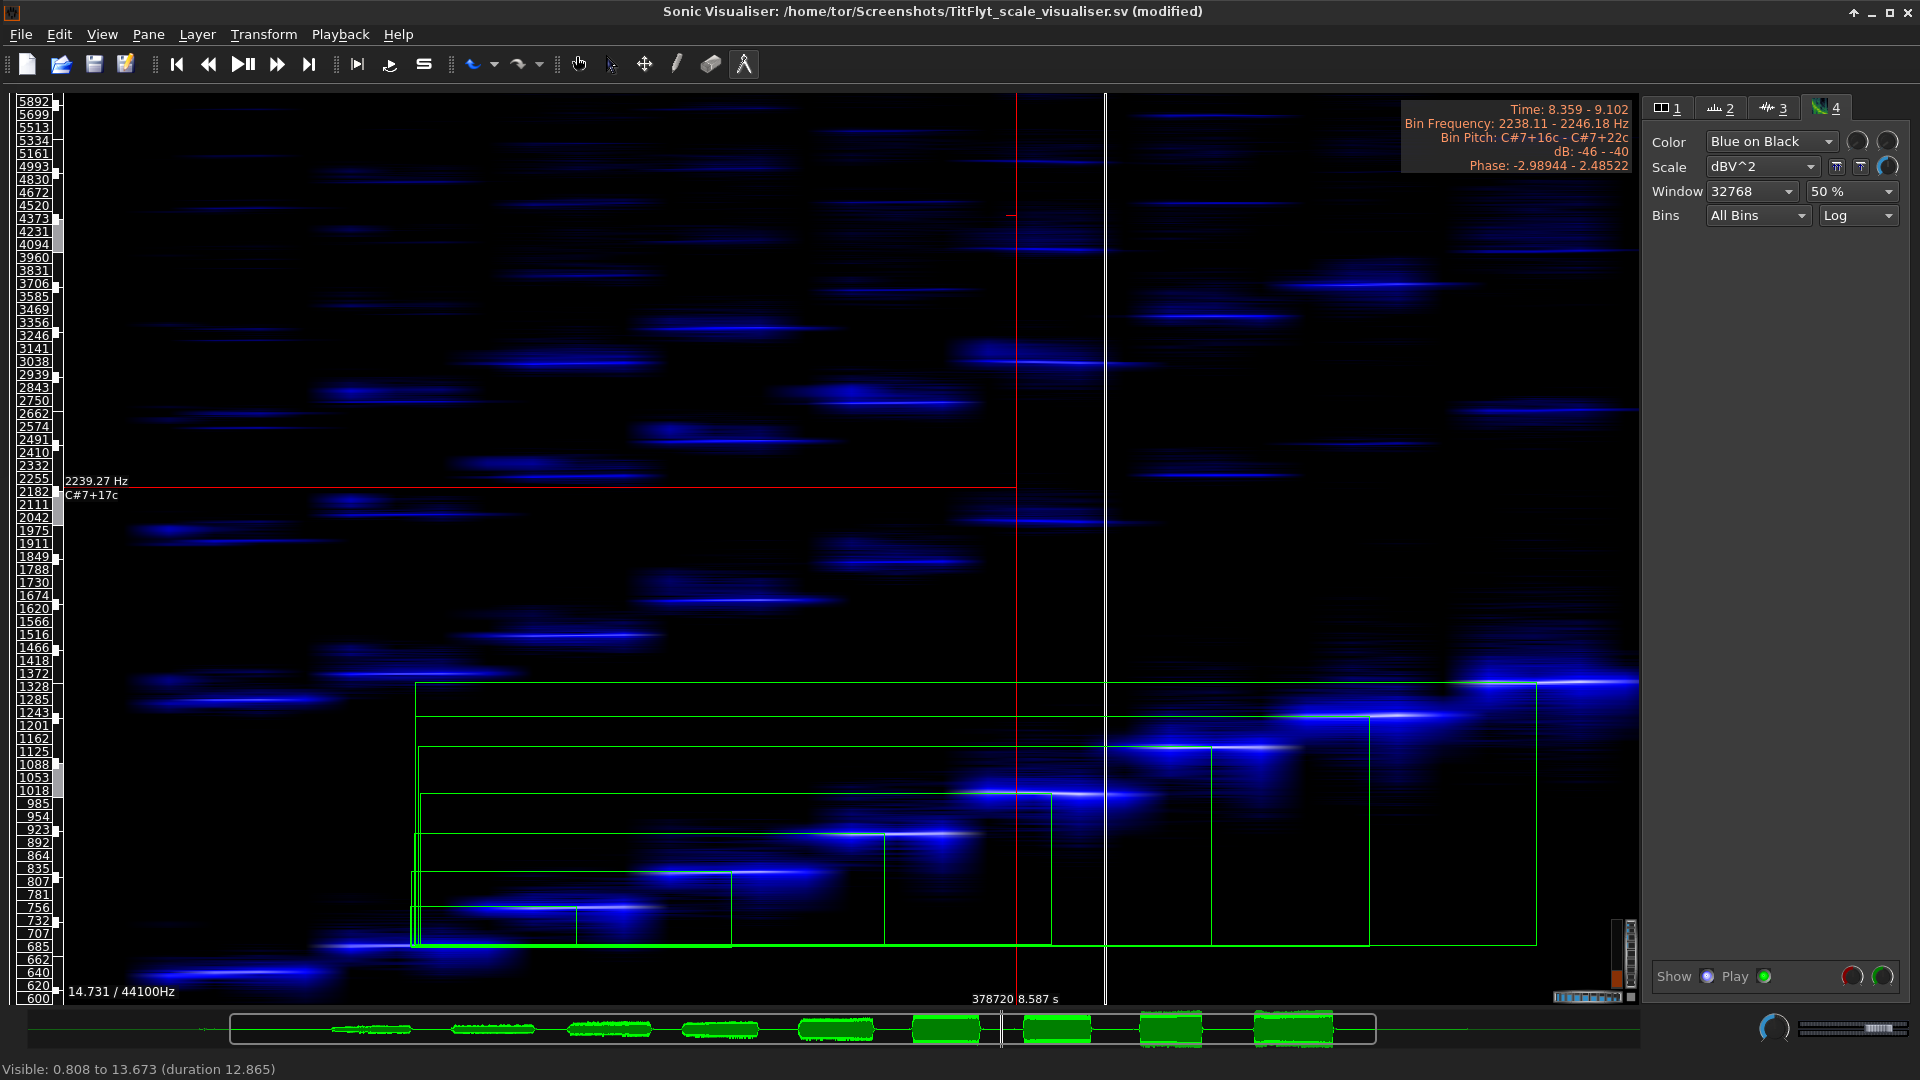
Measuring intervals from a ground tone
The lowest note of the scale is not necessarily the lowest note on the instrument. On my flute for example, the musical scale actually starts with the first hole opened (the hole closed is a transitional note, not a significant tonal center).
Final notes
Other software exist to measure pitches and scales in the opensource world. Praat for instance is great too in its own right. But Praat was designed primarily for linguistics while Sonic visualiser was aimed primarily at musicologists. Praat has many features relevant for speech analysis, but I find Sonic Visualiser more versatile and easier to use in my work as an ethnomusicologist. I published here some sonograms made with Sonic Visualiser. For other ethnomusicological examples, see also this multimedia presentation by Estelle Amy de la Bretèque.